Logistic Regression Model Logistic Regression 是一種非常常用的 Machine Learning 演算法,主要用於做 Classification 的任務,可以把資料轉換成一個機率。舉個例子,假設我們要預測一個人是否會患有特定疾病,這時候我們就可以使用 Logistic Regression 來把這個問題轉換成一個機率,表示該個人患有該疾病的可能性有多高。
Logistic Regression 和 Linear Regression 最大的差別就是 Cost Function 不同,Linear Regression 需要使用 Squared Error 來計算 Cost,但 Logistic Regression 則需要使用 Log function 來計算 Cost,還可以使用 Gradient Descent 來求得最佳的 theta。另外,還有一些進階的方法,例如 Conjugate gradient、BFGS、L-BFGS 等,可以求出更快更有效率的 theta。
在處理 Classification 的 logistic regression 時
我們的 cost function 不能和 linear regression 一樣使用 :
J ( θ ) = 1 m ∑ i = 1 m 1 2 ( h θ ( x ( i ) ) − y ( i ) ) 2 J(\theta) = \frac{1}{m}\sum_{i=1}^m \color{red}{\frac{1}{2} (h_\theta(x^{(i)})- y^{(i)})^2} J ( θ ) = m 1 i = 1 ∑ m 2 1 ( h θ ( x ( i ) ) − y ( i ) ) 2 原因如下,我們把 sum 後面那一段簡寫成 :
Cost ( h θ ( x ) , y ) = 1 2 ( h θ ( x ) − y ) 2 \text{Cost}(h_\theta(x), y) = \frac{1}{2}(h_\theta(x)-y)^2 Cost ( h θ ( x ) , y ) = 2 1 ( h θ ( x ) − y ) 2 而其中的 h(x) 在 logistic regression 時需要帶入 :
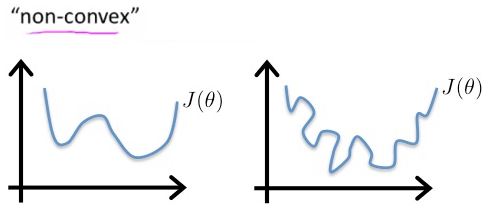
Cost ( h θ ( x ) , y ) = 1 2 ( 1 1 + e − θ T x − y ) 2 \text{Cost}(h_\theta(x), y) = \frac{1}{2}(\frac{1}{1+e^{-\theta^Tx}}-y)^2 Cost ( h θ ( x ) , y ) = 2 1 ( 1 + e − θ T x 1 − y ) 2 這個 complicated nonlinear function 會使得 cost function 變為 non-convex
也就是有多個 local optima 難以 converge
Non-convex function 所以針對 logistic regression 有另一套 cost function :
J ( θ ) = 1 m ∑ i = 1 m Cost ( h θ ( x ( i ) ) , y ( i ) ) Cost ( h θ ( x ) , y ) = − log ( h θ ( x ) ) if y = 1 Cost ( h θ ( x ) , y ) = − log ( 1 − h θ ( x ) ) if y = 0 \begin{aligned} &J(\theta) = \frac{1}{m}\sum_{i=1}^m \text{Cost}(h_\theta(x^{(i)}),y^{(i)})\\ &\text{Cost}(h_\theta(x),y) = -\log(h_\theta(x))&& \text{ if } y = 1\\ &\text{Cost}(h_\theta(x),y) = -\log(1 - h_\theta(x))&& \text{ if } y = 0 \end{aligned} J ( θ ) = m 1 i = 1 ∑ m Cost ( h θ ( x ( i ) ) , y ( i ) ) Cost ( h θ ( x ) , y ) = − log ( h θ ( x )) Cost ( h θ ( x ) , y ) = − log ( 1 − h θ ( x )) if y = 1 if y = 0 跟使用 logistic function 用來表達 classification 的 hypothesis 一樣
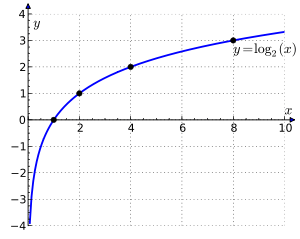
我們用 log function 的特徵加上負號來代表 cost function
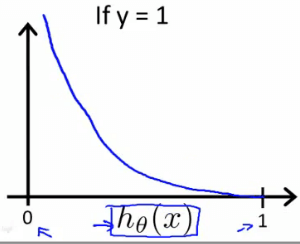
Log function 所以當 y = 1 且我的 h(x) 也為 1 時
代表我準確命中,所以 cost function 應該為 0
而我 h(x) 為 0 時,代表我錯的離譜,所以 cost function 會 → ∞
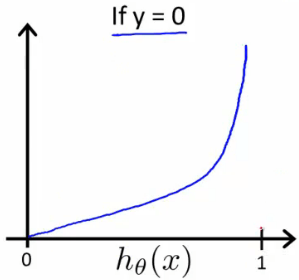
Cost function when y = 1 而當 y = 0 且我 h(x) 也為 0 時
一樣表示我準確命中,所以 cost function 為 0
而 h(x) 為 1 時,錯的離譜,所以 cost function 一樣 → ∞
Cost function when y = 0 現在我們得到一個 cost function J 他是一定能夠 converge 的 convex function
Cost ( h θ ( x ) , y ) = 0 if h θ ( x ) = y Cost ( h θ ( x ) , y ) → ∞ if y = 0 and h θ ( x ) → 1 Cost ( h θ ( x ) , y ) → ∞ if y = 1 and h θ ( x ) → 0 \begin{aligned} &\text{Cost}(h_\theta(x), y) = 0 \text{ if } h_\theta(x) = y\\ &\text{Cost}(h_\theta(x), y) \rightarrow \infty \text{ if } y = 0 \text{ and } h_\theta(x) \rightarrow 1\\ &\text{Cost}(h_\theta(x), y) \rightarrow \infty \text{ if } y = 1 \text{ and } h_\theta(x) \rightarrow 0 \end{aligned} Cost ( h θ ( x ) , y ) = 0 if h θ ( x ) = y Cost ( h θ ( x ) , y ) → ∞ if y = 0 and h θ ( x ) → 1 Cost ( h θ ( x ) , y ) → ∞ if y = 1 and h θ ( x ) → 0 我們可以將兩行的 cost function 濃縮成一行 :
Cost ( h θ ( x ) , y ) = − y log ( h θ ( x ) ) − ( 1 − y ) log ( 1 − h θ ( x ) ) \text{Cost}(h_\theta(x), y) = -y \log(h_\theta(x)) - (1 - y) \log (1-h_\theta(x)) Cost ( h θ ( x ) , y ) = − y log ( h θ ( x )) − ( 1 − y ) log ( 1 − h θ ( x )) Cost ( h θ ( x ) , y ) = − log ( h θ ( x ) ) \text{Cost}(h_\theta(x), y) = -\log(h_\theta(x)) Cost ( h θ ( x ) , y ) = − log ( h θ ( x )) Cost ( h θ ( x ) , y ) = − log ( 1 − h θ ( x ) ) \text{Cost}(h_\theta(x), y) = -\log(1-h_\theta(x)) Cost ( h θ ( x ) , y ) = − log ( 1 − h θ ( x )) 所以完整的 cost function J 為
J ( θ ) = − 1 m ∑ i = 1 m [ y ( i ) log ( h θ ( x ( i ) ) ) + ( 1 − y ( i ) ) log ( 1 − h θ ( x ( i ) ) ) ] J(\theta) = - \frac{1}{m}\sum_{i=1}^m [y^{(i)}\log(h_\theta(x^{(i)})) + (1 - y^{(i)})\log(1-h_\theta(x^{(i)}))] J ( θ ) = − m 1 i = 1 ∑ m [ y ( i ) log ( h θ ( x ( i ) )) + ( 1 − y ( i ) ) log ( 1 − h θ ( x ( i ) ))] {% hint style="info" %}
可以再進化成 vectorized function
h = g ( X θ ) J ( θ ) = 1 m ⋅ ( − y T log ( h ) − ( 1 − y ) T log ( 1 − h ) ) \begin{aligned} h = g(X\theta)\\ J(\theta) = \frac{1}{m} \cdot (-y^T\log(h)-(1-y)^T\log(1-h)) \end{aligned} h = g ( Xθ ) J ( θ ) = m 1 ⋅ ( − y T log ( h ) − ( 1 − y ) T log ( 1 − h )) {% endhint %}
我們一樣可以使用 Gradient Descent 來找出 cost function 的最小 θ \theta θ
原本的 gradient descent 長這樣 :
Repeat { θ j : = θ j − α d d θ j J ( θ ) } \begin{aligned} &\text{Repeat \{} \\ &\theta_j := \theta_j - \alpha \frac{d}{d\theta_j}J(\theta)\\ &\text{\}} \end{aligned} Repeat { θ j := θ j − α d θ j d J ( θ ) } 現在我們可以將新的 cost function J 插入得到 :
Repeat { θ j : = θ j − α 1 m ∑ i = 1 m ( h θ ( x ( i ) ) − y ( i ) ) x j ( i ) } \begin{aligned} &\text{Repeat \{} \\ &\theta_j := \theta_j - \alpha \frac{1}{m} \sum_{i=1}^{m}(h_\theta(x^{(i)}) - y^{(i)})x^{(i)}_j\\ &\text{\}} \end{aligned} Repeat { θ j := θ j − α m 1 i = 1 ∑ m ( h θ ( x ( i ) ) − y ( i ) ) x j ( i ) } 這個新的 Gradient descent 看起來跟 linear regression 的一模一樣
但實際上裡面的 h(x) 是不同的東西 :
Old : h ( x ) = θ T x New : h ( x ) = 1 1 + e − θ T x \begin{aligned} \text{Old : } h(x) &= \theta^Tx \\ \text{New : } h(x) &= \frac{1}{1+e^{-\theta^Tx}} \end{aligned} Old : h ( x ) New : h ( x ) = θ T x = 1 + e − θ T x 1 {% hint style="info" %}
每個 loop 裡面的 theta 一樣要同時更新,而他的 vectorized implementation 為
θ : = θ − α 1 m X T ( g ( X θ ) − y ⃗ ) \theta := \theta - \alpha \frac{1}{m} X^T (g(X\theta) - \vec{y}) θ := θ − α m 1 X T ( g ( Xθ ) − y ) {% endhint %}
有一些進階的方法可以求 optimize theta
例如 :
Conjugate gradient BFGS L-BFGS 這些方法比起自己寫的 gradient descent 還要更快更有效率
也不需手動決定 learning rate
但十分複雜,不過我們可以透過一些 library 來直接執行
在 Octave 中我們呼叫 fminunc() 來實作
我們需要提供以下兩個東西的數值,分別為
J ( θ ) and d d θ j J ( θ ) J(\theta) \text{ and } \frac{d}{d\theta_j}J(\theta) J ( θ ) and d θ j d J ( θ ) 這邊我們建立一個 costFunction
function [jVal, gradient] = costFunction(theta)
    jVal = [...code to compute J(theta)...];
    gradient = [...code to compute derivative of J(theta)...];
end
接著要提供 optimset (function 的 options)
以及最初的 θ \theta θ
Octave 程式碼如下 :
options = optimset('GradObj', 'on', 'MaxIter', 100); initialTheta = zeros(2,1); [optTheta, functionVal, exitFlag] = fminunc(@costFunction, initialTheta, options); 舉個簡單的例子 :
要找到該 Cost function 最小的 theta (一看就知道兩個都是 5)
θ = [ θ 1 θ 2 ] J ( θ ) = ( θ 1 − 5 ) 2 + ( θ 2 − 5 ) 2 d d θ 1 J ( θ ) = 2 ( θ 1 − 5 ) d d θ 2 J ( θ ) = 2 ( θ 2 − 5 ) \begin{aligned} \theta &= \begin{bmatrix}\theta_1\\\theta_2\end{bmatrix}\\ J(\theta) &= (\theta_1 - 5)^2 + (\theta_2 - 5)^2\\ \frac{d}{d\theta_1}J(\theta) &= 2(\theta_1 - 5)\\ \frac{d}{d\theta_2}J(\theta) &= 2(\theta_2 - 5) \end{aligned} θ J ( θ ) d θ 1 d J ( θ ) d θ 2 d J ( θ ) = [ θ 1 θ 2 ] = ( θ 1 − 5 ) 2 + ( θ 2 − 5 ) 2 = 2 ( θ 1 − 5 ) = 2 ( θ 2 − 5 ) 實作 :
function [jVal, gradient] = costFunction(theta) jVal = (theta(1)-5)^2 + (theta(2)-5)^2; gradient = zeros(2, 1); gradient(1) = 2*(theta(1)-5); gradient(2) = 2*(theta(2)-5); end options = optimset('GradObj', 'on', 'MaxIter', 100); initialTheta = zeros(2, 1); [optTheta, functionVal, exitFlag] = fminunc(@costFunction, initialTheta, options); optTheta = 5.0000 5.0000 functionVal = 1.5777e-030 // 就是 cost 0 exitFlag = 1 // 代表 Converge 當 classification 的種類超過兩種以上
也就是 y = {0, 1} 擴充至 y = {0, 1, ... n} 時
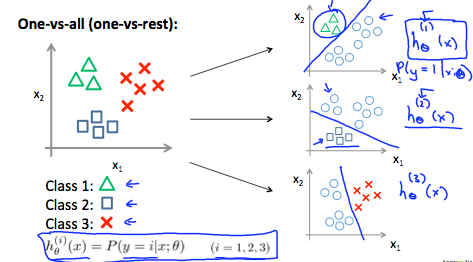
要使用 one-vs-all (one-vs-rest) 的方法來解決
做法就是將 n 個種類的 data 執行 n 次的分類
每一次專注在一種種類,並把其他種類當成一類
y ∈ { 0 , 1 , ⋯ , n } h θ ( 0 ) ( x ) = P ( y = 0 ∣ x ; θ ) h θ ( 1 ) ( x ) = P ( y = 1 ∣ x ; θ ) h θ ( 2 ) ( x ) = P ( y = 2 ∣ x ; θ ) ⋮ h θ ( n ) ( x ) = P ( y = n ∣ x ; θ ) prediction = max i ( h θ ( i ) ( x ) ) \begin{aligned} &y \in \begin{Bmatrix}0,1,\cdots,n\end{Bmatrix}\\ &h_\theta^{(0)} (x) = P(y = 0 \mid x;\theta)\\ &h_\theta^{(1)} (x) = P(y = 1 \mid x;\theta)\\ &h_\theta^{(2)} (x) = P(y = 2 \mid x;\theta)\\ \vdots\\ &h_\theta^{(n)} (x) = P(y = n \mid x;\theta)\\\\ &\text{prediction } = \max_{i}(h_\theta^{(i)}(x)) \end{aligned} ⋮ y ∈ { 0 , 1 , ⋯ , n } h θ ( 0 ) ( x ) = P ( y = 0 ∣ x ; θ ) h θ ( 1 ) ( x ) = P ( y = 1 ∣ x ; θ ) h θ ( 2 ) ( x ) = P ( y = 2 ∣ x ; θ ) h θ ( n ) ( x ) = P ( y = n ∣ x ; θ ) prediction = i max ( h θ ( i ) ( x )) 然後分析每一個 data 在所有 n 個 h(x) 裡誰的機率最高,他就是哪一類
One-vs-all 例如新的 data 要進到裡面來,看他是 class 1, 2, 3 哪一種
就會把三種 h(x) 各跑一次
最後哪一種機率最高,他就是那一個 class
